Quick Answer: Power BI is a powerful business intelligence tool for creating interactive dashboards and reports from large datasets, while Excel is a versatile spreadsheet software for data manipulation, calculation, and basic analysis. Choosing the right training depends on your career goals and the complexity of data you handle. This guide breaks down which tool is right for your team.
That’s the short version. But the real value is in the details below — here’s what actually separates the top performers from everyone else.
Introduction
In today's data-driven business environment, making the right decisions is more critical than ever. Malaysian companies are increasingly looking to harness the power of their data, but many HR managers and L&D professionals face a common problem: a skills gap in their teams. Your employees are likely using Excel for data tasks, but as data volume and complexity grow, you're noticing that reports are becoming slow, cumbersome, and difficult to interpret. This agitation leads to missed insights, inefficient workflows, and a feeling that your organization is falling behind competitors who are making smarter, faster decisions. The solution lies in targeted training, but a new question arises: should you invest in advanced Excel training or make the leap to Power BI? This guide will help you make that critical decision for your Malaysian business.
Power BI vs. Excel: The Core Differences
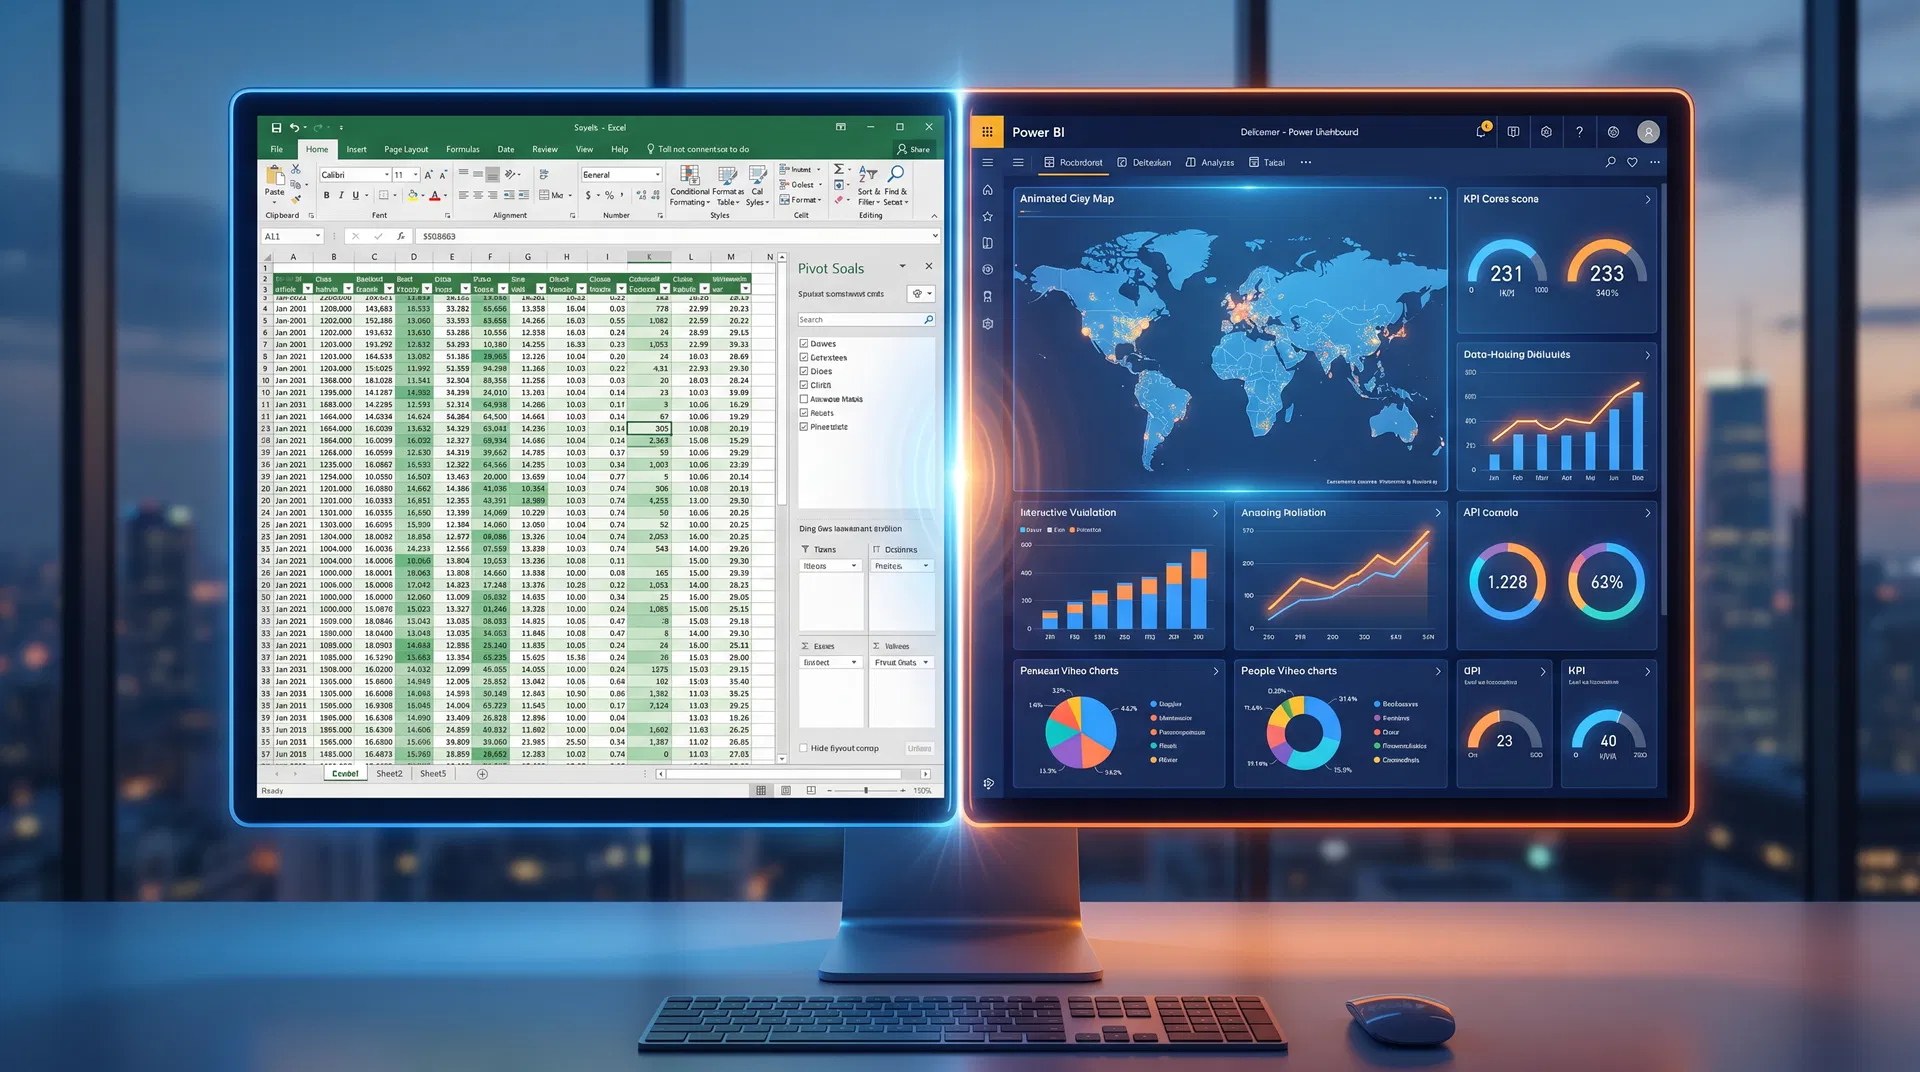
Understanding the fundamental differences between Power BI and Excel is the first step to choosing the right training path. While both are Microsoft products and work well together, they are designed for different purposes.
Excel is the undisputed king of spreadsheets. It's a versatile tool perfect for ad-hoc analysis, financial modeling, and managing smaller datasets. Most office workers have a basic understanding of Excel, making it an accessible starting point. Advanced Excel training can unlock powerful features like PivotTables, Power Query, and complex formulas, significantly boosting an employee's data manipulation skills.
Power BI, on the other hand, is a dedicated business intelligence (BI) and data visualization tool. It’s built to handle large, complex datasets from multiple sources and transform them into interactive, easy-to-understand dashboards and reports. A 2025 report from Randstad Malaysia highlighted data analytics skills, specifically mentioning Power BI and Excel, as highly in-demand for the Malaysian job market [1]. This indicates a clear industry shift towards more sophisticated data analysis.
Power BI vs Excel: Feature-by-Feature Comparison
| Capability | Excel (Advanced) | Power BI |
|---|---|---|
| Data Volume | Up to 1M rows (practical limit) | Millions of rows, multiple sources |
| Data Sources | Manual import, limited connectors | 100+ native connectors |
| Visualization | Basic charts, conditional formatting | Interactive dashboards, 30+ visual types |
| Real-time Data | Manual refresh | Auto-refresh, live connections |
| Collaboration | File sharing, co-authoring | Cloud dashboards, role-based access |
| Learning Curve | Moderate (familiar interface) | Steeper (new concepts: DAX, data modeling) |
| Cost | Included in Microsoft 365 | Free (Desktop) / RM 42/user/month (Pro) |
| Best For | Financial modeling, ad-hoc analysis | Enterprise reporting, executive dashboards |
Training Investment Comparison (Malaysia)
| Factor | Excel Advanced Training | Power BI Training |
|---|---|---|
| Typical Duration | 2-3 days | 3-5 days |
| Cost Range (per pax) | RM 800 - RM 1,500 | RM 1,200 - RM 2,500 |
| HRD Corp Claimable | Yes | Yes |
| Time to Productivity | 1-2 weeks | 2-4 weeks |
| ROI Timeline | Immediate improvements | 1-3 months for full adoption |
| Prerequisite Skills | Basic Excel | Basic Excel + data concepts |
When to Choose Excel Training
Investing in advanced Excel training is a great choice when your team's primary needs revolve around:
- Financial analysis and accounting: Excel remains the industry standard for detailed financial modeling, budgeting, and forecasting.
- Data cleaning and manipulation: For tasks that require manual data entry, cleaning, and organization of smaller datasets, Excel is often more efficient.
- Ad-hoc analysis: When your team needs to perform quick calculations or create simple charts for a specific, one-off task, Excel is the go-to tool.
For many Malaysian SMEs, mastering advanced Excel is a cost-effective way to significantly improve their data capabilities without the steeper learning curve of a new platform.
When to Choose Power BI Training
Power BI training becomes essential when your organization's goals include:
- Handling large datasets: Power BI can process millions of rows of data without the performance issues that plague Excel.
- Integrating multiple data sources: If you need to pull data from various systems like SQL databases, cloud services, and even other Excel files into a single report, Power BI is the superior choice.
- Creating interactive, real-time dashboards: Power BI allows users to create dynamic reports that can be refreshed automatically and explored with interactive filters and slicers. This is crucial for management and sales teams who need up-to-the-minute insights.
According to a projection, the demand for Power BI professionals in Malaysia is expected to grow significantly by 2025 [2], reflecting its increasing adoption by local companies aiming to become more data-centric.
The Malaysian Context: Job Roles and Industry Demand
The choice between Power BI and Excel training also depends on specific job roles within your organization.
- For Finance and Accounting Teams: While Excel is their primary tool, Power BI training can empower them to create more insightful and automated financial reports for stakeholders.
- For Sales and Marketing Teams: Power BI is a game-changer. It allows them to visualize sales performance by region, track marketing campaign ROI in real-time, and identify customer trends.
- For HR and Operations Teams: Power BI can be used to create dashboards for tracking employee performance metrics, analyzing recruitment data, and monitoring operational efficiency.
Many Malaysian companies are now seeking professionals with T-shaped skills – deep expertise in their domain (like finance or HR) combined with a strong proficiency in data analysis tools like Power BI. By providing this training, you are not only improving your company's performance but also investing in your employees' career growth.
Real-World Example: A Malaysian Retail Company's Journey
To illustrate the power of choosing the right tool, consider the case of a mid-sized retail company in Kuala Lumpur specializing in fast-moving consumer goods (FMCG). For years, they relied on a team of analysts using Excel to track daily sales from their 20 stores across the Klang Valley. Each store would email their daily sales report, which was then manually consolidated into a master Excel file. The process was not only time-consuming, taking an analyst several hours each day, but also prone to human error. The monthly sales reports for management were static and often delivered a week after the month had ended, making them historical documents rather than strategic tools.
The management team knew they needed more timely and actionable insights to compete with larger retail chains. They were struggling to answer critical questions quickly: Which products were selling best in which stores? How were their weekend promotions impacting overall sales? Where should they allocate their marketing budget for the best return?
After an internal review, they decided to invest in Power BI training for their analysis team through a HRD Corp claimable program. The training focused on connecting to multiple data sources (in this case, the individual store databases), automating the data consolidation process with Power Query, and building a central sales dashboard.
Within two months of completing the training, the team had developed a real-time sales dashboard. Now, the management team could instantly see sales performance across all stores, filter by product category, and track the effectiveness of promotions as they happened. They discovered that certain high-margin products were consistently out of stock in high-traffic stores, an insight that was previously buried in their Excel reports. By addressing this single issue, they were able to increase sales by 5% in the following quarter. This practical example showcases how the transition from Excel to Power BI, supported by the right training, can unlock significant business value for Malaysian companies.
Making the Right Training Investment with TrainerLink
Choosing the right training provider is as important as choosing the right tool. It's crucial to find programs that are not only comprehensive but also relevant to the Malaysian business landscape. TrainerLink offers a wide range of HRD Corp claimable courses in both advanced Excel and Power BI, delivered by experienced local trainers. By partnering with TrainerLink, you can ensure your team receives practical, hands-on training that they can immediately apply to their roles, driving better data-driven decisions for your organization.
Frequently Asked Questions
Is Power BI harder to learn than Excel?
Power BI has a steeper initial learning curve than Excel, especially for users unfamiliar with data modeling concepts. However, its user-friendly interface for creating visualizations can make it feel more intuitive in some aspects. For Excel power users, the transition is often smooth as they are already familiar with tools like Power Query, which is also a core component of Power BI.
Can Power BI replace Excel?
No, Power BI is not a replacement for Excel. The two tools are complementary. Many workflows involve cleaning and preparing data in Excel before importing it into Power BI for visualization and analysis. Excel is better for ad-hoc calculations and data entry, while Power BI is superior for reporting and dashboarding.
What are the main differences between Power BI and Excel?
The three main differences are data capacity (Power BI handles much larger datasets), data visualization (Power BI offers more advanced and interactive options), and collaboration (Power BI is a cloud-based service designed for easy sharing and collaboration on reports and dashboards).
Conclusion
The decision to invest in Power BI or Excel training is a strategic one that depends on your company's specific needs, data maturity, and long-term goals. For foundational data skills and detailed financial tasks, advanced Excel training is invaluable. For large-scale data analysis, interactive reporting, and building a data-driven culture, Power BI is the future. By assessing your team's roles and the demands of the Malaysian market, you can make an informed choice. And with a platform like TrainerLink, you can easily find and book the right HRD Corp claimable training to empower your workforce and unlock the full potential of your business data.
AI Summary: This article compares Power BI and Excel training for Malaysian businesses. It highlights that Excel is ideal for smaller datasets and financial tasks, while Power BI excels at large-scale data analysis and interactive reporting. The choice of training should be based on specific job roles and the company's data strategy to meet the growing demand for data skills in the Malaysian job market.
References
[1] Randstad Malaysia. (2024). *2025 job market outlook & salary guide*. Retrieved from https://www.randstad.com.my/s3fs-media/my/public/2024-12/randstad-malaysia-2025-job-market-outlook-and-salary-guide.pdf
[2] Telecom Engineering College. (n.d.). *Power BI demand is expected to grow by 63% by 2025*. Facebook. Retrieved from https://www.facebook.com/telecomengineeringcollege/posts/power-bi-demand-is-expected-to-grow-by-63-by-2025-with-malaysia-projected-to-req/1198506885624935/